Using the dynamic factory connector
This tutorial assumes that the Factory Connector has been registered with the Factory Gateway and that the “Aircraft Lavatory” sample collaborative production plan has been loaded and saved in the Production Monitoring tool.
After starting the Dynamic Factory Connector, use a web browser to access its user interface by navigating to :3000 (where dfc-host is the name of the machine running the Dynamic Factory Connector and could also be “localhost”):

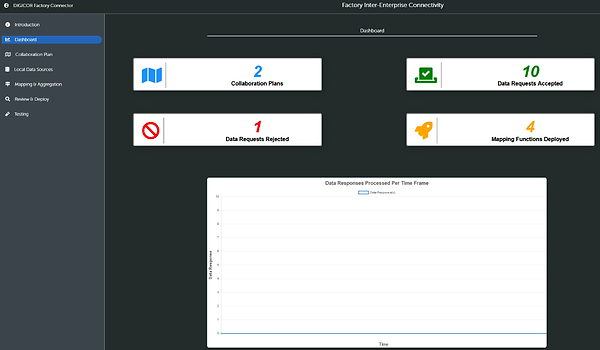
The Dashboard shows operational statistics:

In order to answer dynamic data requests (as created by, for example, the Production Monitoring Tool), the Collaborative Process Twin containing the requests is specified on the “Collaboration Plan” tab:

The Mapping Engine should connect automatically. After clicking on “Browse Collaboration Plan”, the address space of the Collaborative Process Twin appears:

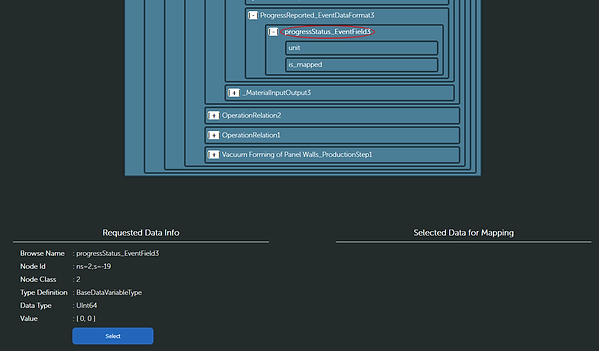
Browse to a dynamic data request that is to be answered, and select it such that it is marked by a red circle:

Detailed information on the selected node is shown in the lower left corner. To confirm that this dynamic data request shall be answered, click “Select”:

Clicking the right arrow (“>>>”) or “Local Data Sources” (on the left panel) opens the next panel, where local data sources can be selected:

Start the DIGICOR CNC Simulation, and select the URI of its OPC UA server from the drop-down menu “OPC-UA URL”. Then, enter a name for that data source under “Data source name”, e.g. “cnc”:

Click on “Connect” in order to connect to the OPC UA server:

In order to browse the address space, select the name of the server from the dropdown menu in the middle:

Browse to the nodes that contain the information that is needed to establish the mapping:

Select them (indicated by a red circle) and click on “Select” in order to confirm selection. Multiple nodes can be selected:

Next, go to “Mapping & Aggregation”:

In this panel, it is possible to create a mapping function for the dynamic data requests. Each mapping function must have a unique name, and JavaScript function code. The following sample function shows how local information – which CNC job is executing – can be mapped to progress information that is relevant to the collaboration partners, assuming that front, back and side wall moulds are milled in that order:
switch (ActProgramStatus.value) {
case 0:
switch (ActMainProgramName.value) {
case 'A320LavatoryJob':
switch (ActProgramName.value){
case 'Front':
progressStatus_EventField3.value = 1;
break;
case 'Back':
progressStatus_EventField3.value = 2;
break;
case 'Side':
progressStatus_EventField3.value = 3;
break;
}
}
}
return progressStatus_EventField3;
Insert it as “Function Code”:

Alternatively, it is possible to choose from builtin mapping functions. These can be accessed by clicking on “Show Blueprints”:

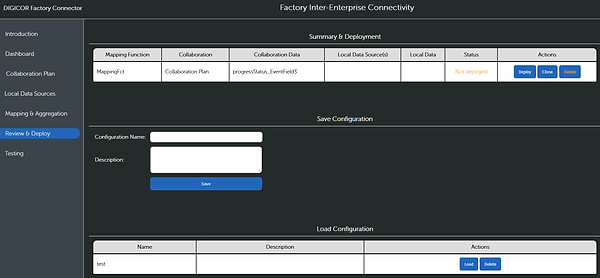
After the mapping function has been chosen, click on “Create Mapping”. This moves to the “Review & Deploy” tab:

The table “Summary & Deployment” lists all mapping functions. Chose the one that shall be activated by clicking on “Deploy”:

The mapping function can also be deactivated again by clicking on “Freeze”.
Now go back to the DIGICOR portal, select the production plan, and enable autoreload:

When you now use the CNC Simulation to simulate that tooling the mould progresses, you will see how the production process is updated in the production monitoring tool.

